New Holland Honeyeater
Phylidonyris novaehollandiae
ABR description
The following is extracted from the Annual Bird Report for the twelve months to June 2017.
Uncommon, breeding resident
Uncommon but reported regularly from a few locations where grevilleas or banksias are abundant.
General: The number of records, number of birds and reporting rate have all increased from last year. This does not necessarily reflect a real increase in the population as 88% of records are from two locations and probably reporting the same birds; ANBG (26% of records) and JWNR (62%). The seasonal pattern is typical for this species with most records in spring (35%) and fewest in summer (18%). Max 20/15 Aug ANBG (HoS1), mean 3.6 and median 2. 12 breeding records, more than any other year, but most records are probably of the same breeding events; first nb/31 July JWNR (LaK1), dy/18 Nov ANBG (MiP1).
GBS: 35 records this year, down from 54 records last year. Records at 5 sites: Chapman, Duffy, Gleneagles, Giralang, and Carwoola GrQ16. Abundance has fluctuated greatly over the years. Following a period of low abundance from 2002 to 2009, the A value steadily increased until 2012 and has remained fairly stable around the present value of A=0.0304, close to the 30YA. Seasonal distribution similar to the other years with only one record between 3wk Aug and 1wk Jan. 1 breeding record this year: dy/2wk Jan Carwoola (BuM1). This is only the 7th year in the history of the GBS where breeding has been recorded.

Abundance
Abundance is the average number of birds of that species per survey. Where the species was observed (presence recorded) but the number of birds seen was not recorded, this is treated as a count of zero.
Abundance by year
This chart shows the abundance of New Holland Honeyeater between 1982 and 2017. 
Abundance by month
This chart shows the monthly abundance of New Holland Honeyeater. The blue lines show the abundance for the twelve months to June 2017 and the bars show the average abundance for the period 1982 to 2017. 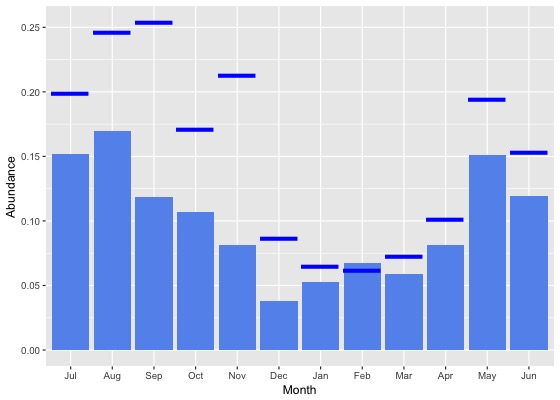
Abundance by season
This chart shows the seasonal abundance of New Holland Honeyeater. The blue lines show the seasonal abundance for the twelve months to June 2017 and the bars show the average seasonal abundance for the period 1982 to 2017. 
Abundance data
| Month | Season | ||||||||||||||||||
|---|---|---|---|---|---|---|---|---|---|---|---|---|---|---|---|---|---|---|---|
| Period | Jul | Aug | Sep | Oct | Nov | Dec | Jan | Feb | Mar | Apr | May | Jun | Winter | Spring | Summer | Autumn | All | ||
| All years | |||||||||||||||||||
| All | 0.2 | 0.2 | 0.1 | 0.1 | 0.1 | 0.0 | 0.1 | 0.1 | 0.1 | 0.1 | 0.2 | 0.1 | 0.1 | 0.1 | 0.1 | 0.1 | 0.1 | ||
| Previous years | |||||||||||||||||||
| All previous years | 0.1 | 0.2 | 0.1 | 0.1 | 0.1 | 0.0 | 0.1 | 0.1 | 0.1 | 0.1 | 0.1 | 0.1 | 0.1 | 0.1 | 0.0 | 0.1 | 0.1 | ||
| Previous 30 years | 0.1 | 0.2 | 0.1 | 0.1 | 0.1 | 0.0 | 0.0 | 0.1 | 0.1 | 0.1 | 0.1 | 0.1 | 0.1 | 0.1 | 0.0 | 0.1 | 0.1 | ||
| Previous 20 years | 0.2 | 0.2 | 0.1 | 0.1 | 0.1 | 0.0 | 0.1 | 0.1 | 0.1 | 0.1 | 0.2 | 0.1 | 0.1 | 0.1 | 0.1 | 0.1 | 0.1 | ||
| 10 year groups | |||||||||||||||||||
| [2007,2017) | 0.2 | 0.2 | 0.1 | 0.1 | 0.1 | 0.0 | 0.1 | 0.1 | 0.1 | 0.1 | 0.2 | 0.2 | 0.2 | 0.1 | 0.1 | 0.1 | 0.1 | ||
| [1997,2007) | 0.1 | 0.1 | 0.1 | 0.1 | 0.0 | 0.0 | 0.0 | 0.1 | 0.0 | 0.1 | 0.1 | 0.0 | 0.1 | 0.1 | 0.0 | 0.1 | 0.1 | ||
| [1987,1997) | 0.1 | 0.1 | 0.1 | 0.1 | 0.0 | 0.0 | 0.0 | 0.0 | 0.1 | 0.0 | 0.1 | 0.1 | 0.1 | 0.1 | 0.0 | 0.1 | 0.1 | ||
| 5 year groups | |||||||||||||||||||
| [2012,2017) | 0.2 | 0.2 | 0.1 | 0.1 | 0.1 | 0.0 | 0.1 | 0.1 | 0.1 | 0.1 | 0.2 | 0.2 | 0.2 | 0.1 | 0.1 | 0.1 | 0.1 | ||
| [2007,2012) | 0.2 | 0.2 | 0.1 | 0.1 | 0.1 | 0.0 | 0.1 | 0.1 | 0.1 | 0.1 | 0.1 | 0.1 | 0.2 | 0.1 | 0.1 | 0.1 | 0.1 | ||
| [2002,2007) | 0.1 | 0.1 | 0.0 | 0.1 | 0.0 | 0.0 | 0.1 | 0.1 | 0.0 | 0.0 | 0.1 | 0.0 | 0.1 | 0.1 | 0.0 | 0.0 | 0.1 | ||
| [1997,2002) | 0.1 | 0.2 | 0.1 | 0.1 | 0.0 | 0.0 | 0.0 | 0.0 | 0.0 | 0.1 | 0.1 | 0.0 | 0.1 | 0.1 | 0.0 | 0.1 | 0.1 | ||
| [1992,1997) | 0.2 | 0.1 | 0.0 | 0.0 | 0.0 | 0.0 | 0.0 | 0.0 | 0.0 | 0.0 | 0.1 | 0.1 | 0.1 | 0.0 | 0.0 | 0.0 | 0.0 | ||
| [1987,1992) | 0.1 | 0.1 | 0.1 | 0.1 | 0.0 | 0.0 | 0.0 | 0.0 | 0.1 | 0.0 | 0.1 | 0.1 | 0.1 | 0.1 | 0.0 | 0.1 | 0.1 | ||
| Year | |||||||||||||||||||
| 2017 | 0.2 | 0.2 | 0.3 | 0.2 | 0.2 | 0.1 | 0.1 | 0.1 | 0.1 | 0.1 | 0.2 | 0.2 | 0.2 | 0.2 | 0.1 | 0.1 | 0.1 | ||
| 2016 | 0.2 | 0.2 | 0.1 | 0.1 | 0.1 | 0.1 | 0.1 | 0.1 | 0.0 | 0.1 | 0.2 | 0.2 | 0.2 | 0.1 | 0.1 | 0.1 | 0.1 | ||
| 2015 | 0.2 | 0.3 | 0.3 | 0.3 | 0.1 | 0.0 | 0.0 | 0.1 | 0.1 | 0.2 | 0.2 | 0.1 | 0.2 | 0.2 | 0.1 | 0.2 | 0.2 | ||
| 2014 | 0.2 | 0.2 | 0.0 | 0.0 | 0.0 | 0.0 | 0.1 | 0.1 | 0.1 | 0.1 | 0.4 | 0.1 | 0.2 | 0.0 | 0.1 | 0.2 | 0.1 | ||
| 2013 | 0.3 | 0.1 | 0.1 | 0.1 | 0.1 | 0.0 | 0.0 | 0.0 | 0.1 | 0.0 | 0.2 | 0.1 | 0.2 | 0.1 | 0.0 | 0.1 | 0.1 | ||
| 2012 | 0.1 | 0.1 | 0.1 | 0.1 | 0.0 | 0.0 | 0.1 | 0.1 | 0.1 | 0.0 | 0.2 | 0.1 | 0.1 | 0.1 | 0.1 | 0.1 | 0.1 | ||
| 2011 | 0.5 | 0.1 | 0.1 | 0.1 | 0.1 | 0.1 | 0.1 | 0.0 | 0.0 | 0.0 | 0.0 | 0.1 | 0.2 | 0.1 | 0.1 | 0.0 | 0.1 | ||
| 2010 | 0.1 | 0.2 | 0.1 | 0.1 | 0.2 | 0.0 | 0.0 | 0.1 | 0.0 | 0.1 | 0.2 | 0.1 | 0.1 | 0.1 | 0.0 | 0.0 | 0.1 | ||
| 2009 | 0.2 | 0.3 | 0.2 | 0.0 | 0.1 | 0.0 | 0.1 | 0.0 | 0.1 | 0.0 | 0.1 | 0.1 | 0.2 | 0.1 | 0.1 | 0.1 | 0.1 | ||
| 2008 | 0.2 | 0.4 | 0.1 | 0.1 | 0.1 | 0.0 | 0.1 | 0.1 | 0.1 | 0.1 | 0.3 | 0.0 | 0.2 | 0.1 | 0.1 | 0.1 | 0.1 | ||
| 2007 | 0.1 | 0.2 | 0.0 | 0.1 | 0.0 | 0.1 | 0.0 | 0.2 | 0.1 | 0.1 | 0.4 | 0.4 | 0.3 | 0.1 | 0.1 | 0.1 | 0.1 | ||
| 2006 | 0.0 | 0.1 | 0.0 | 0.2 | 0.0 | 0.0 | 0.2 | 0.1 | 0.1 | 0.1 | 0.1 | 0.0 | 0.1 | 0.1 | 0.1 | 0.1 | 0.1 | ||
| 2005 | 0.1 | 0.2 | 0.1 | 0.0 | 0.1 | 0.0 | 0.0 | 0.1 | 0.0 | 0.0 | 0.1 | 0.0 | 0.1 | 0.0 | 0.0 | 0.0 | 0.0 | ||
| 2004 | 0.2 | 0.1 | 0.0 | 0.1 | 0.0 | 0.0 | 0.0 | 0.1 | 0.0 | 0.0 | 0.1 | 0.0 | 0.1 | 0.0 | 0.0 | 0.0 | 0.1 | ||
| 2003 | 0.0 | 0.3 | 0.0 | 0.0 | 0.0 | 0.0 | 0.0 | 0.2 | 0.0 | 0.1 | 0.1 | 0.1 | 0.1 | 0.0 | 0.1 | 0.0 | 0.1 | ||
| 2002 | 0.0 | 0.1 | 0.0 | 0.0 | 0.0 | 0.0 | 0.0 | 0.0 | 0.0 | 0.0 | 0.0 | 0.0 | 0.0 | 0.0 | 0.0 | 0.0 | 0.0 | ||
| 2001 | 0.0 | 0.0 | 0.0 | 0.0 | 0.0 | 0.0 | 0.0 | 0.0 | 0.0 | 0.0 | 0.0 | 0.0 | 0.0 | 0.0 | 0.0 | 0.0 | 0.0 | ||
| 2000 | 0.1 | 0.3 | 0.1 | 0.0 | 0.1 | 0.0 | 0.0 | 0.1 | 0.0 | 0.1 | 0.0 | 0.0 | 0.1 | 0.1 | 0.0 | 0.1 | 0.1 | ||
| 1999 | 0.0 | 0.4 | 0.1 | 0.1 | 0.0 | 0.0 | 0.0 | 0.0 | 0.1 | 0.0 | 0.2 | 0.1 | 0.2 | 0.1 | 0.0 | 0.1 | 0.1 | ||
| 1998 | 0.0 | 0.0 | 0.3 | 0.2 | 0.0 | 0.0 | 0.1 | 0.0 | 0.0 | 0.0 | 0.0 | 0.0 | 0.0 | 0.2 | 0.0 | 0.0 | 0.1 | ||
| 1997 | 0.1 | 0.0 | 0.0 | 0.0 | 0.0 | 0.0 | 0.0 | 0.0 | 0.4 | 0.1 | 0.8 | 0.0 | 0.1 | 0.0 | 0.0 | 0.3 | 0.1 | ||
| 1996 | 0.4 | 0.0 | 0.0 | 0.0 | 0.0 | 0.0 | 0.1 | 0.0 | 0.0 | 0.0 | 0.0 | 0.1 | 0.1 | 0.0 | 0.0 | 0.0 | 0.0 | ||
| 1995 | 0.0 | 0.0 | 0.0 | 0.0 | 0.1 | 0.0 | 0.0 | 0.0 | 0.0 | 0.1 | 0.0 | 0.1 | 0.1 | 0.0 | 0.0 | 0.0 | 0.0 | ||
| 1994 | 0.2 | 0.0 | 0.1 | 0.0 | 0.0 | 0.0 | 0.0 | 0.0 | 0.0 | 0.0 | 0.0 | 0.1 | 0.1 | 0.0 | 0.0 | 0.0 | 0.0 | ||
| 1993 | 0.2 | 0.0 | 0.0 | 0.0 | 0.0 | 0.0 | 0.0 | 0.0 | 0.0 | 0.0 | 0.1 | 0.0 | 0.1 | 0.0 | 0.0 | 0.0 | 0.0 | ||
| 1992 | 0.0 | 0.6 | 0.0 | 0.2 | 0.0 | 0.0 | 0.0 | 0.0 | 0.0 | 0.1 | 0.2 | 0.0 | 0.2 | 0.1 | 0.0 | 0.1 | 0.1 | ||
| 1991 | 0.1 | 0.1 | 0.2 | 0.3 | 0.1 | 0.0 | 0.0 | 0.0 | 0.3 | 0.1 | 0.0 | 0.2 | 0.1 | 0.2 | 0.0 | 0.1 | 0.1 | ||
| 1990 | 0.0 | 0.1 | 0.1 | 0.0 | 0.0 | 0.0 | 0.0 | 0.0 | 0.1 | 0.0 | 0.1 | 0.2 | 0.1 | 0.0 | 0.0 | 0.1 | 0.1 | ||
| 1989 | 0.1 | 0.1 | 0.1 | 0.0 | 0.0 | 0.0 | 0.0 | 0.0 | 0.1 | 0.0 | 0.1 | 0.1 | 0.1 | 0.1 | 0.0 | 0.1 | 0.1 | ||
| 1988 | 0.1 | 0.1 | 0.1 | 0.1 | 0.0 | 0.0 | 0.0 | 0.0 | 0.1 | 0.1 | 0.1 | 0.0 | 0.1 | 0.1 | 0.0 | 0.1 | 0.1 | ||
| 1987 | 0.1 | 0.1 | 0.0 | 0.0 | 0.0 | 0.0 | 0.0 | 0.0 | 0.0 | 0.0 | 0.0 | 0.1 | 0.1 | 0.0 | 0.0 | 0.0 | 0.0 | ||
| 1986 | 0.1 | 0.2 | 0.3 | 0.4 | 0.2 | 0.1 | 0.2 | 0.1 | 0.1 | 0.1 | 0.1 | 0.1 | 0.1 | 0.3 | 0.1 | 0.1 | 0.2 | ||
| 1985 | 0.2 | 0.0 | 0.0 | 0.0 | 0.1 | 0.0 | 0.1 | 0.1 | 0.1 | 0.2 | 0.1 | 0.4 | 0.2 | 0.0 | 0.0 | 0.1 | 0.1 | ||
| 1984 | 0.0 | 0.0 | 0.0 | 0.0 | 0.0 | 0.0 | 0.0 | 0.0 | 0.2 | 0.0 | 0.0 | 0.0 | 0.0 | 0.0 | 0.0 | 0.1 | 0.0 | ||
| 1983 | 0.0 | 0.0 | 0.0 | 0.0 | 0.0 | 0.0 | 0.0 | 0.0 | 0.0 | - | 0.0 | 0.0 | 0.0 | 0.0 | 0.0 | 0.0 | 0.0 | ||
| 1982 | - | 0.0 | - | 0.0 | 0.0 | 0.0 | - | 0.0 | - | 0.0 | - | 0.0 | 0.0 | 0.0 | 0.0 | 0.0 | 0.0 | ||
Reporting rates
Reporting rate is the proportion of all surveys in which the species was present.
Reporting rate by year
This chart shows the reporting rate of New Holland Honeyeater each year between 1982 and 2017. 
Reporting rate by month
This chart shows the reporting rate by month of New Holland Honeyeater. The blue lines show the reporting rate for the twelve months to June 2017 and the bars show the average reporting rate for the period 1982 to 2017. 
Reporting rate by season
This chart shows the seasonal reporting rate of New Holland Honeyeater. The blue lines show the seasonal reporting rate for the twelve months to June 2017 and the bars show the average seasonal reporting rate for the period 1982 to 2017. 
Reporting rate data
| Month | Season | ||||||||||||||||||
|---|---|---|---|---|---|---|---|---|---|---|---|---|---|---|---|---|---|---|---|
| Period | Jul | Aug | Sep | Oct | Nov | Dec | Jan | Feb | Mar | Apr | May | Jun | Winter | Spring | Summer | Autumn | All | ||
| All years | |||||||||||||||||||
| All | 5.4 | 6.0 | 4.6 | 4.1 | 4.1 | 2.6 | 3.2 | 3.6 | 2.9 | 3.5 | 5.1 | 3.6 | 4.8 | 4.3 | 3.1 | 3.7 | 3.9 | ||
| Previous years | |||||||||||||||||||
| All previous years | 5.5 | 6.1 | 4.5 | 3.9 | 3.8 | 2.5 | 3.2 | 3.8 | 2.9 | 3.3 | 5.1 | 3.6 | 4.9 | 4.1 | 3.1 | 3.6 | 3.9 | ||
| Previous 30 years | 5.5 | 6.1 | 4.4 | 3.9 | 3.7 | 2.5 | 3.2 | 3.8 | 2.8 | 3.2 | 5.1 | 3.6 | 4.9 | 4.0 | 3.1 | 3.5 | 3.8 | ||
| Previous 20 years | 5.3 | 6.5 | 4.5 | 4.0 | 4.0 | 2.5 | 3.3 | 4.0 | 2.6 | 3.2 | 5.2 | 3.3 | 4.8 | 4.1 | 3.2 | 3.4 | 3.8 | ||
| 10 year groups | |||||||||||||||||||
| [2007,2017) | 5.8 | 6.9 | 5.5 | 4.0 | 4.8 | 3.0 | 3.4 | 3.9 | 2.9 | 3.3 | 5.4 | 3.7 | 5.2 | 4.6 | 3.4 | 3.6 | 4.2 | ||
| [1997,2007) | 4.4 | 5.7 | 2.3 | 3.7 | 2.3 | 1.6 | 3.0 | 4.1 | 2.1 | 2.9 | 4.5 | 2.4 | 3.9 | 2.8 | 2.7 | 2.9 | 3.0 | ||
| [1987,1997) | 6.1 | 4.7 | 4.4 | 3.7 | 2.9 | 2.4 | 2.6 | 3.1 | 3.9 | 3.6 | 4.8 | 5.0 | 5.2 | 3.6 | 2.7 | 4.1 | 3.9 | ||
| 5 year groups | |||||||||||||||||||
| [2012,2017) | 5.6 | 6.6 | 5.4 | 4.2 | 4.6 | 3.2 | 3.0 | 3.9 | 2.9 | 3.7 | 5.0 | 3.9 | 5.2 | 4.7 | 3.4 | 3.7 | 4.2 | ||
| [2007,2012) | 6.2 | 8.1 | 5.8 | 3.7 | 5.4 | 2.4 | 4.7 | 4.0 | 2.7 | 2.2 | 6.6 | 3.5 | 5.2 | 4.6 | 3.6 | 3.4 | 4.2 | ||
| [2002,2007) | 5.3 | 6.6 | 2.5 | 4.6 | 2.7 | 1.6 | 4.8 | 6.2 | 2.5 | 3.2 | 5.0 | 2.4 | 4.4 | 3.3 | 3.6 | 3.3 | 3.6 | ||
| [1997,2002) | 2.9 | 4.6 | 2.1 | 2.4 | 1.9 | 1.7 | 1.1 | 2.0 | 1.6 | 2.6 | 3.8 | 2.4 | 3.2 | 2.1 | 1.6 | 2.5 | 2.3 | ||
| [1992,1997) | 4.9 | 1.4 | 2.0 | 1.9 | 1.2 | 1.2 | 0.5 | 2.5 | 1.6 | 2.5 | 4.3 | 3.5 | 3.1 | 1.7 | 1.3 | 2.7 | 2.2 | ||
| [1987,1992) | 6.7 | 6.5 | 5.5 | 4.6 | 3.7 | 2.9 | 3.8 | 3.3 | 5.3 | 4.3 | 5.0 | 5.8 | 6.4 | 4.6 | 3.3 | 4.9 | 4.8 | ||
| Year | |||||||||||||||||||
| 2017 | 4.5 | 5.5 | 5.1 | 5.7 | 6.3 | 3.2 | 3.1 | 2.2 | 2.7 | 4.2 | 4.8 | 3.3 | 4.3 | 5.7 | 2.8 | 3.8 | 4.1 | ||
| 2016 | 4.8 | 6.6 | 4.3 | 3.4 | 3.4 | 3.3 | 2.1 | 4.2 | 2.5 | 3.5 | 4.8 | 4.9 | 5.5 | 3.7 | 3.2 | 3.5 | 3.8 | ||
| 2015 | 4.0 | 7.2 | 7.7 | 5.3 | 4.0 | 1.8 | 1.4 | 3.4 | 3.5 | 4.8 | 3.9 | 3.4 | 4.6 | 5.7 | 2.1 | 4.1 | 4.1 | ||
| 2014 | 7.3 | 7.1 | 2.9 | 2.5 | 2.6 | 2.1 | 3.6 | 3.1 | 3.2 | 5.4 | 9.2 | 2.6 | 5.0 | 2.6 | 3.1 | 5.3 | 3.9 | ||
| 2013 | 11.4 | 7.2 | 6.7 | 4.4 | 8.7 | 5.3 | 5.1 | 4.1 | 2.2 | 2.3 | 4.2 | 2.2 | 6.5 | 6.3 | 5.0 | 2.6 | 5.0 | ||
| 2012 | 4.3 | 4.3 | 5.1 | 5.7 | 5.2 | 3.2 | 4.9 | 5.4 | 3.9 | 1.9 | 4.8 | 5.4 | 4.8 | 5.4 | 4.5 | 3.3 | 4.6 | ||
| 2011 | 5.7 | 3.2 | 5.0 | 2.8 | 2.4 | 3.0 | 5.3 | 1.4 | 1.9 | 0.9 | 3.3 | 1.2 | 2.5 | 3.4 | 3.5 | 2.0 | 2.9 | ||
| 2010 | 8.3 | 7.9 | 9.4 | 5.5 | 5.7 | 2.9 | 4.3 | 5.9 | 1.2 | 3.0 | 6.9 | 3.4 | 5.5 | 6.6 | 3.9 | 2.9 | 5.0 | ||
| 2009 | 2.9 | 12.5 | 6.4 | 2.2 | 6.7 | 1.1 | 6.7 | 4.2 | 3.3 | 1.2 | 5.3 | 2.7 | 4.8 | 4.3 | 3.7 | 2.9 | 3.9 | ||
| 2008 | 7.6 | 11.3 | 4.5 | 3.4 | 5.4 | 0.9 | 6.3 | 5.6 | 3.8 | 2.8 | 11.7 | 2.3 | 6.1 | 4.0 | 3.5 | 4.7 | 4.5 | ||
| 2007 | 7.7 | 6.5 | 3.3 | 4.8 | 6.1 | 3.4 | 2.4 | 6.1 | 4.3 | 3.4 | 10.6 | 7.5 | 7.3 | 4.6 | 3.4 | 5.2 | 5.0 | ||
| 2006 | 2.0 | 3.9 | 2.6 | 5.4 | 1.8 | 1.1 | 7.3 | 6.7 | 3.8 | 2.2 | 8.0 | 2.7 | 2.7 | 3.8 | 4.9 | 4.2 | 3.9 | ||
| 2005 | 5.1 | 6.5 | 3.3 | 4.4 | 4.8 | 2.4 | 7.8 | 7.6 | 3.5 | 3.3 | 5.5 | 0.8 | 3.2 | 4.0 | 5.0 | 4.1 | 4.0 | ||
| 2004 | 9.5 | 11.2 | 3.4 | 7.6 | 4.1 | 1.8 | 4.8 | 7.1 | 1.6 | 2.2 | 1.9 | 1.2 | 7.6 | 4.9 | 4.0 | 1.9 | 4.7 | ||
| 2003 | 5.1 | 5.8 | 1.3 | 2.6 | 2.3 | 0.0 | 3.0 | 8.2 | 1.3 | 5.5 | 3.9 | 6.8 | 6.0 | 2.0 | 3.4 | 3.5 | 3.5 | ||
| 2002 | 2.3 | 4.2 | 1.5 | 3.0 | 1.0 | 2.1 | 0.6 | 2.0 | 1.4 | 2.4 | 4.7 | 1.6 | 2.5 | 1.9 | 1.7 | 2.3 | 2.1 | ||
| 2001 | 1.8 | 3.0 | 1.5 | 2.5 | 1.7 | 1.4 | 2.0 | 2.1 | 0.9 | 1.5 | 3.5 | 1.0 | 1.9 | 1.9 | 1.8 | 1.7 | 1.8 | ||
| 2000 | 4.0 | 5.2 | 2.8 | 2.2 | 3.7 | 2.0 | 0.8 | 2.4 | 1.6 | 3.1 | 0.9 | 2.7 | 3.9 | 2.9 | 1.7 | 2.1 | 2.5 | ||
| 1999 | 2.9 | 6.2 | 1.7 | 2.5 | 1.3 | 3.8 | 0.7 | 1.4 | 2.2 | 2.1 | 5.1 | 3.3 | 4.1 | 1.8 | 2.1 | 3.1 | 2.7 | ||
| 1998 | 5.4 | 5.7 | 4.1 | 3.3 | 0.9 | 0.0 | 1.5 | 1.9 | 1.1 | 7.7 | 3.7 | 2.7 | 4.2 | 2.7 | 0.9 | 3.1 | 2.6 | ||
| 1997 | 3.4 | 3.4 | 0.9 | 1.3 | 0.9 | 0.0 | 0.0 | 1.8 | 5.0 | 2.8 | 6.7 | 2.8 | 3.2 | 1.0 | 0.5 | 4.1 | 2.1 | ||
| 1996 | 10.4 | 1.1 | 1.3 | 1.8 | 0.9 | 0.0 | 1.0 | 1.2 | 1.0 | 1.6 | 1.7 | 4.6 | 4.8 | 1.3 | 0.7 | 1.3 | 2.0 | ||
| 1995 | 3.2 | 1.6 | 1.9 | 0.6 | 1.8 | 1.1 | 0.0 | 4.8 | 1.0 | 4.8 | 2.6 | 2.1 | 2.2 | 1.3 | 1.5 | 3.0 | 2.0 | ||
| 1994 | 3.9 | 1.3 | 5.9 | 2.3 | 0.0 | 2.2 | 1.5 | 1.7 | 1.1 | 0.8 | 3.8 | 3.4 | 2.8 | 2.1 | 1.7 | 1.7 | 2.0 | ||
| 1993 | 6.1 | 1.3 | 0.0 | 2.7 | 3.0 | 2.2 | 0.0 | 3.1 | 1.2 | 1.7 | 5.2 | 2.9 | 3.1 | 2.0 | 1.6 | 2.8 | 2.4 | ||
| 1992 | 1.5 | 1.9 | 1.2 | 3.2 | 1.4 | 1.6 | 0.0 | 2.4 | 4.2 | 3.4 | 7.9 | 5.0 | 2.8 | 2.0 | 1.2 | 5.3 | 2.9 | ||
| 1991 | 3.1 | 4.3 | 1.2 | 2.9 | 6.2 | 2.7 | 0.0 | 2.0 | 4.8 | 5.1 | 1.6 | 6.0 | 4.1 | 3.5 | 1.7 | 3.8 | 3.4 | ||
| 1990 | 5.2 | 7.6 | 6.5 | 3.1 | 1.9 | 2.8 | 4.2 | 2.8 | 3.4 | 1.2 | 1.4 | 3.9 | 6.0 | 3.7 | 3.3 | 2.0 | 4.1 | ||
| 1989 | 10.7 | 6.9 | 7.4 | 5.4 | 4.0 | 2.6 | 4.3 | 4.1 | 6.7 | 5.1 | 7.9 | 7.7 | 8.4 | 5.7 | 3.6 | 6.5 | 6.0 | ||
| 1988 | 5.6 | 6.0 | 6.7 | 6.2 | 4.8 | 3.1 | 4.0 | 3.4 | 5.9 | 6.4 | 7.1 | 4.8 | 5.5 | 5.8 | 3.5 | 6.5 | 5.4 | ||
| 1987 | 18.2 | 13.3 | 4.0 | 3.5 | 2.4 | 3.3 | 4.1 | 2.9 | 4.3 | 2.9 | 3.5 | 5.9 | 7.0 | 3.2 | 3.4 | 3.5 | 3.7 | ||
| 1986 | 15.4 | 18.4 | 15.1 | 16.7 | 17.0 | 14.7 | 8.7 | 8.3 | 9.7 | 13.7 | 13.8 | 8.6 | 14.1 | 16.2 | 10.8 | 12.6 | 13.7 | ||
| 1985 | 3.3 | 3.3 | 1.9 | 2.3 | 1.8 | 1.7 | 12.5 | 11.8 | 27.3 | 15.8 | 20.0 | 17.9 | 8.0 | 2.1 | 4.7 | 20.0 | 5.6 | ||
| 1984 | 0.0 | 0.0 | 0.0 | 0.0 | 0.0 | 0.0 | 0.0 | 0.0 | 3.7 | 2.9 | 3.2 | 2.9 | 2.0 | 0.0 | 0.0 | 3.3 | 1.7 | ||
| 1983 | 0.0 | 0.0 | 0.0 | 0.0 | 0.0 | 0.0 | 0.0 | 0.0 | 0.0 | - | 0.0 | 0.0 | 0.0 | 0.0 | 0.0 | 0.0 | 0.0 | ||
| 1982 | - | 0.0 | - | 0.0 | 0.0 | 0.0 | - | 0.0 | - | 0.0 | - | 0.0 | 0.0 | 0.0 | 0.0 | 0.0 | 0.0 | ||
Breeding data
Breeding records by month
Number of breeding records by breeding code and month, 2017 and all years| Breeding code | Jul | Aug | Sep | Oct | Nov | Dec | Jan | Feb | Mar | Apr | May | Jun |
|---|---|---|---|---|---|---|---|---|---|---|---|---|
| 2017 | ||||||||||||
| Breeding (BLA code) | 0 | 0 | 0 | 0 | 0 | 0 | 0 | 0 | 0 | 0 | 0 | 0 |
| Carrying Food | 0 | 0 | 0 | 0 | 0 | 0 | 0 | 0 | 0 | 0 | 0 | 0 |
| Copulating | 0 | 0 | 0 | 0 | 0 | 0 | 0 | 0 | 0 | 0 | 0 | 0 |
| Display | 0 | 0 | 0 | 1 | 0 | 0 | 0 | 0 | 0 | 0 | 0 | 0 |
| Dependent young | 0 | 0 | 2 | 1 | 7 | 0 | 0 | 0 | 0 | 0 | 0 | 0 |
| Faecal sac | 0 | 0 | 0 | 0 | 0 | 0 | 0 | 0 | 0 | 0 | 0 | 0 |
| Inspecting hollow | 0 | 0 | 0 | 0 | 0 | 0 | 0 | 0 | 0 | 0 | 0 | 0 |
| Nest building | 1 | 0 | 0 | 0 | 0 | 0 | 0 | 0 | 0 | 0 | 0 | 0 |
| Nest with eggs | 0 | 0 | 0 | 0 | 0 | 0 | 0 | 0 | 0 | 0 | 0 | 0 |
| Nest with young | 0 | 0 | 0 | 0 | 0 | 0 | 0 | 0 | 0 | 0 | 0 | 0 |
| On/leaving nest | 0 | 0 | 0 | 0 | 0 | 0 | 0 | 0 | 0 | 0 | 0 | 0 |
| All years | ||||||||||||
| Breeding (BLA code) | 0 | 0 | 0 | 2 | 1 | 1 | 0 | 0 | 0 | 0 | 0 | 0 |
| Carrying Food | 0 | 0 | 0 | 5 | 0 | 0 | 0 | 0 | 1 | 0 | 0 | 0 |
| Copulating | 0 | 0 | 0 | 0 | 0 | 0 | 0 | 0 | 0 | 0 | 0 | 0 |
| Display | 0 | 0 | 0 | 1 | 0 | 0 | 0 | 0 | 0 | 0 | 0 | 0 |
| Dependent young | 0 | 5 | 6 | 3 | 8 | 1 | 1 | 1 | 1 | 0 | 0 | 0 |
| Faecal sac | 0 | 0 | 0 | 1 | 0 | 0 | 0 | 0 | 0 | 0 | 0 | 0 |
| Inspecting hollow | 0 | 0 | 0 | 0 | 0 | 0 | 0 | 0 | 0 | 0 | 0 | 0 |
| Nest building | 1 | 0 | 0 | 1 | 2 | 0 | 0 | 1 | 0 | 0 | 0 | 0 |
| Nest with eggs | 0 | 0 | 0 | 0 | 0 | 0 | 0 | 0 | 0 | 0 | 0 | 0 |
| Nest with young | 0 | 2 | 0 | 0 | 0 | 0 | 0 | 0 | 0 | 0 | 0 | 0 |
| On/leaving nest | 0 | 0 | 0 | 0 | 0 | 0 | 0 | 0 | 0 | 0 | 0 | 0 |
Breeding records by year
Average number of breeding records per period by breeding code| Period | Breeding (BLA code) | Carrying Food | Copulating | Display | Dependent young | Faecal sac | Inspecting hollow | Nest building | Nest with eggs | Nest with young | On/leaving nest |
|---|---|---|---|---|---|---|---|---|---|---|---|
| All years | |||||||||||
| All | 0.1 | 0.2 | 0.0 | 0.0 | 0.7 | 0.0 | 0.0 | 0.1 | 0.0 | 0.1 | 0.0 |
| Previous years | |||||||||||
| All previous years | 0.1 | 0.2 | 0.0 | 0.0 | 0.5 | 0.0 | 0.0 | 0.1 | 0.0 | 0.1 | 0.0 |
| Previous 30 years | 0.1 | 0.2 | 0.0 | 0.0 | 0.5 | 0.0 | 0.0 | 0.1 | 0.0 | 0.1 | 0.0 |
| Previous 20 years | 0.2 | 0.1 | 0.0 | 0.0 | 0.3 | 0.0 | 0.0 | 0.1 | 0.0 | 0.1 | 0.0 |
| 10 year groups | |||||||||||
| [2007,2017) | 0.4 | 0.2 | 0.0 | 0.0 | 0.6 | 0.1 | 0.0 | 0.1 | 0.0 | 0.0 | 0.0 |
| [1997,2007) | 0.0 | 0.0 | 0.0 | 0.0 | 0.1 | 0.0 | 0.0 | 0.1 | 0.0 | 0.2 | 0.0 |
| [1987,1997) | 0.0 | 0.4 | 0.0 | 0.0 | 0.9 | 0.0 | 0.0 | 0.2 | 0.0 | 0.0 | 0.0 |
| 5 year groups | |||||||||||
| [2012,2017) | 0.0 | 0.0 | 0.0 | 0.0 | 0.4 | 0.2 | 0.0 | 0.0 | 0.0 | 0.0 | 0.0 |
| [2007,2012) | 0.8 | 0.4 | 0.0 | 0.0 | 0.8 | 0.0 | 0.0 | 0.2 | 0.0 | 0.0 | 0.0 |
| [2002,2007) | 0.0 | 0.0 | 0.0 | 0.0 | 0.2 | 0.0 | 0.0 | 0.0 | 0.0 | 0.0 | 0.0 |
| [1997,2002) | 0.0 | 0.0 | 0.0 | 0.0 | 0.0 | 0.0 | 0.0 | 0.2 | 0.0 | 0.4 | 0.0 |
| [1992,1997) | 0.0 | 0.0 | 0.0 | 0.0 | 0.0 | 0.0 | 0.0 | 0.0 | 0.0 | 0.0 | 0.0 |
| [1987,1992) | 0.0 | 0.8 | 0.0 | 0.0 | 1.8 | 0.0 | 0.0 | 0.4 | 0.0 | 0.0 | 0.0 |
| Year | |||||||||||
| 2017 | 0.0 | 0.0 | 0.0 | 1.0 | 10.0 | 0.0 | 0.0 | 1.0 | 0.0 | 0.0 | 0.0 |
| 2016 | 0.0 | 0.0 | 0.0 | 0.0 | 1.0 | 0.0 | 0.0 | 0.0 | 0.0 | 0.0 | 0.0 |
| 2015 | 0.0 | 0.0 | 0.0 | 0.0 | 0.0 | 1.0 | 0.0 | 0.0 | 0.0 | 0.0 | 0.0 |
| 2014 | 0.0 | 0.0 | 0.0 | 0.0 | 1.0 | 0.0 | 0.0 | 0.0 | 0.0 | 0.0 | 0.0 |
| 2013 | 0.0 | 0.0 | 0.0 | 0.0 | 0.0 | 0.0 | 0.0 | 0.0 | 0.0 | 0.0 | 0.0 |
| 2012 | 0.0 | 0.0 | 0.0 | 0.0 | 0.0 | 0.0 | 0.0 | 0.0 | 0.0 | 0.0 | 0.0 |
| 2011 | 0.0 | 0.0 | 0.0 | 0.0 | 2.0 | 0.0 | 0.0 | 0.0 | 0.0 | 0.0 | 0.0 |
| 2010 | 1.0 | 0.0 | 0.0 | 0.0 | 0.0 | 0.0 | 0.0 | 0.0 | 0.0 | 0.0 | 0.0 |
| 2009 | 1.0 | 0.0 | 0.0 | 0.0 | 1.0 | 0.0 | 0.0 | 0.0 | 0.0 | 0.0 | 0.0 |
| 2008 | 0.0 | 1.0 | 0.0 | 0.0 | 1.0 | 0.0 | 0.0 | 0.0 | 0.0 | 0.0 | 0.0 |
| 2007 | 2.0 | 1.0 | 0.0 | 0.0 | 0.0 | 0.0 | 0.0 | 1.0 | 0.0 | 0.0 | 0.0 |
| 2006 | 0.0 | 0.0 | 0.0 | 0.0 | 0.0 | 0.0 | 0.0 | 0.0 | 0.0 | 0.0 | 0.0 |
| 2005 | 0.0 | 0.0 | 0.0 | 0.0 | 1.0 | 0.0 | 0.0 | 0.0 | 0.0 | 0.0 | 0.0 |
| 2004 | 0.0 | 0.0 | 0.0 | 0.0 | 0.0 | 0.0 | 0.0 | 0.0 | 0.0 | 0.0 | 0.0 |
| 2003 | 0.0 | 0.0 | 0.0 | 0.0 | 0.0 | 0.0 | 0.0 | 0.0 | 0.0 | 0.0 | 0.0 |
| 2002 | 0.0 | 0.0 | 0.0 | 0.0 | 0.0 | 0.0 | 0.0 | 0.0 | 0.0 | 0.0 | 0.0 |
| 2001 | 0.0 | 0.0 | 0.0 | 0.0 | 0.0 | 0.0 | 0.0 | 0.0 | 0.0 | 0.0 | 0.0 |
| 2000 | 0.0 | 0.0 | 0.0 | 0.0 | 0.0 | 0.0 | 0.0 | 1.0 | 0.0 | 2.0 | 0.0 |
| 1999 | 0.0 | 0.0 | 0.0 | 0.0 | 0.0 | 0.0 | 0.0 | 0.0 | 0.0 | 0.0 | 0.0 |
| 1998 | 0.0 | 0.0 | 0.0 | 0.0 | 0.0 | 0.0 | 0.0 | 0.0 | 0.0 | 0.0 | 0.0 |
| 1997 | 0.0 | 0.0 | 0.0 | 0.0 | 0.0 | 0.0 | 0.0 | 0.0 | 0.0 | 0.0 | 0.0 |
| 1996 | 0.0 | 0.0 | 0.0 | 0.0 | 0.0 | 0.0 | 0.0 | 0.0 | 0.0 | 0.0 | 0.0 |
| 1995 | 0.0 | 0.0 | 0.0 | 0.0 | 0.0 | 0.0 | 0.0 | 0.0 | 0.0 | 0.0 | 0.0 |
| 1994 | 0.0 | 0.0 | 0.0 | 0.0 | 0.0 | 0.0 | 0.0 | 0.0 | 0.0 | 0.0 | 0.0 |
| 1993 | 0.0 | 0.0 | 0.0 | 0.0 | 0.0 | 0.0 | 0.0 | 0.0 | 0.0 | 0.0 | 0.0 |
| 1992 | 0.0 | 0.0 | 0.0 | 0.0 | 0.0 | 0.0 | 0.0 | 0.0 | 0.0 | 0.0 | 0.0 |
| 1991 | 0.0 | 0.0 | 0.0 | 0.0 | 0.0 | 0.0 | 0.0 | 0.0 | 0.0 | 0.0 | 0.0 |
| 1990 | 0.0 | 0.0 | 0.0 | 0.0 | 0.0 | 0.0 | 0.0 | 0.0 | 0.0 | 0.0 | 0.0 |
| 1989 | 0.0 | 2.0 | 0.0 | 0.0 | 3.0 | 0.0 | 0.0 | 2.0 | 0.0 | 0.0 | 0.0 |
| 1988 | 0.0 | 1.0 | 0.0 | 0.0 | 3.0 | 0.0 | 0.0 | 0.0 | 0.0 | 0.0 | 0.0 |
| 1987 | 0.0 | 1.0 | 0.0 | 0.0 | 3.0 | 0.0 | 0.0 | 0.0 | 0.0 | 0.0 | 0.0 |
| 1986 | 0.0 | 0.0 | 0.0 | 0.0 | 0.0 | 0.0 | 0.0 | 0.0 | 0.0 | 0.0 | 0.0 |
| 1985 | 0.0 | 0.0 | 0.0 | 0.0 | 0.0 | 0.0 | 0.0 | 0.0 | 0.0 | 0.0 | 0.0 |
| 1984 | 0.0 | 0.0 | 0.0 | 0.0 | 0.0 | 0.0 | 0.0 | 0.0 | 0.0 | 0.0 | 0.0 |
| 1983 | 0.0 | 0.0 | 0.0 | 0.0 | 0.0 | 0.0 | 0.0 | 0.0 | 0.0 | 0.0 | 0.0 |
| 1982 | 0.0 | 0.0 | 0.0 | 0.0 | 0.0 | 0.0 | 0.0 | 0.0 | 0.0 | 0.0 | 0.0 |
Distribution map
Distribution - 2017
This map shows the observed distribution of the New Holland Honeyeater for 2017.
The red circles are the grid cells where New Holland Honeyeater have been reported.
The transparency of the red circles indicate how many surveys sheets were submitted for that grid cell; the darker the red the more reliable the data. Of the 315 grid cells with reports, 83 had only one sheet; an example is grid number A9.
The size of the circle represents the reporting rate. The maximum reporting rate for New Holland Honeyeater was 100.0% (eg grid number A9) and the minimum was 0.2% (eg grid number K14). 
Distribution - all years
This map shows the observed distribution of the New Holland Honeyeater for all years.
The red circles are the grid cells where New Holland Honeyeater have been reported.
The transparency of the red circles indicate how many surveys sheets were submitted for that grid cell; the darker the red the more reliable the data. Of the 703 grid cells with reports, 55 had only one sheet; an example is grid number U26.
The size of the circle represents the reporting rate. The maximum reporting rate for New Holland Honeyeater was 100.0% (eg grid number U26) and the minimum was 0.1% (eg grid number L10). 
Breeding map
Breeding - 2017
This map shows the breeding distribution of the New Holland Honeyeater for 2017.
The red circles are the grid cells where breeding activity for New Holland Honeyeater have been reported.
The size of the circle represents the number of reports. 
Breeding - all years
This map shows the breeding distribution of the New Holland Honeyeater for all years.
The red circles are the grid cells where breeding activity for New Holland Honeyeater have been reported.
The size of the circle represents the number of reports. 